Upsell Champions
A Data-Driven Approach to Server Performance Optimization
Executive Summary
Analysis of 3,259 Summer 2025 transactions identified $3,900 in incremental revenue—unlocked via existing internal expertise rather than new hires. To ensure sustainable implementation, our current priority is mitigating peak-hour workload stress, which currently triggers skill-based performance collapses during high-volume shifts.
Tool used : SQL, Spreadsheet, Python, Tableau
PHASE 1 : ASK
The management team at BrewBup is preparing for the high-volume summer season. To maximize profitability during this peak period, they want to revamp their new-hire training program to focus heavily on high-margin upselling. Instead of relying on generic training materials, management wants to identify and leverage their in-house talent. They need to find last summer's 'Upsell Champions'—the servers who statistically outperformed the rest of the staff in specific categories—so these top performers can share their exact table-side strategies with the new hires.
The Core Analytical Question: Based on last summer's transactional data, which servers achieved the highest attachment rates across key dinner upsell categories (Wine Bottles, Second Drinks, Hot Drinks, and Desserts), and by what margin did they outperform the restaurant baseline?
PHASE 2 : PREPARE
Due to limitations of the legacy Veloce POS system, I engineered a Python-based ETL pipeline to parse exported PDF reports, validate totals against control figures, and load structured data into PostgreSQL.
All data used in this case study is proprietary first-party data sourced directly from the POS system. This ensures the dataset meets high quality standards: it is reliable, original, comprehensive, current, and cited.
All data in this analysis has been anonymized to protect client confidentiality.
A key limitation of this dataset is that the POS only records successful upsells, not attempted ones. A low attachment rate could reflect poor technique, poor timing, or simply an unlucky run of disinterested tables — the data alone cannot distinguish between these.
PHASE 3 : PROCESS
To ensure data accuracy, the raw dataset was filtered to include only :
To have a relevant picture of the server upsell in the summer season I kept only transactions between 2025-06-01 and 2025-10-31.
Only bills containing food items, excluding "after-kitchen-hours" bar customers or non-restaurant related checks.
Positive value checks only: Excluding staff discounts and empty checks.
The raw dataset contained 23,898 transactions. After applying quality filters, the final dataset consisted of 3,259 qualified transactions
We focused specifically on items that are considered upsells.
Wine Bottle
Second & Third Drinks
Dessert & Hot Drinks
There are 12 distinct service employees. To ensure statistical significance and eliminate outliers caused by small sample sizes, servers with fewer than 15 total shifts during the period were excluded from the final Upsell Champion rankings, keeping only 7 service employees.
To protect employee confidentiality, all qualifying servers have been anonymized and assigned a randomized ID — gaps in the numbering sequence are intentional and do not reflect missing data.
Since the raw data lacked an exact customer count, I built a logic model to estimate table sizes based on ordering behavior
To avoid artificially inflating the guest count with shared items, I used main courses as the primary indicator of party size. For 'bar-style' tables that only ordered drinks and appetizers, I used the highest quantity between the two categories to estimate the number of guests.
This prevented double-counting and ensured the attachment rate calculations remained accurate.
To observe performance across the different work intensity I divide the shift in 3 categories using the check by night. This allows us to compare server performance across different shift intensity to ensure accuracy.
The 114 nights in the dataset distributed evenly across tiers: 29 slow nights, 55 medium nights, and 30 peak nights — confirming a balanced sample across all shift intensities.
For full details on data cleaning queries, ETL pipeline code, and revenue calculation methodology, visit the project repository on GitHub.
PHASE 4 : ANALYSIS
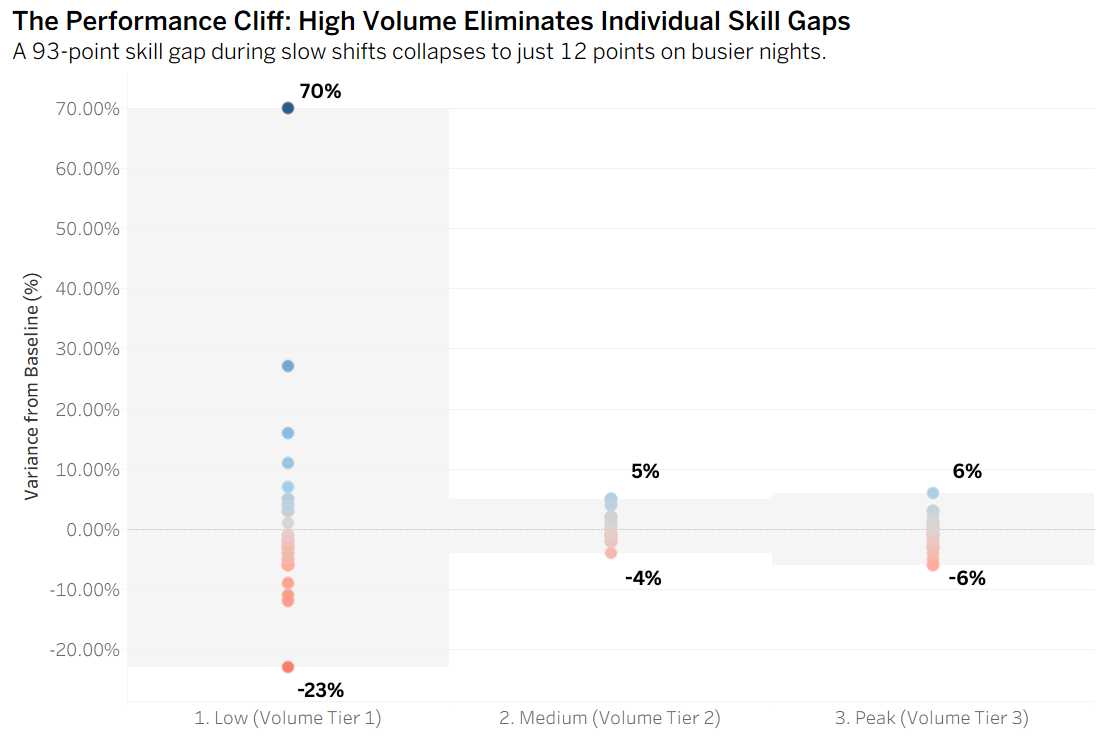
The High-Volume Skill Collapse.
During medium and peak shifts, the performance gap nearly disappears — all servers converge to within a few percentage points of the baseline, proving that individual skill is completely overwhelmed by operational pressure. The floor, not the server, becomes the limiting factor.
2. Restaurant Performance Baseline by Shift Tier
To get an accurate read on performance, I compared each server's numbers to the restaurant's overall baseline. The data showed that our upsell items naturally split into two groups: three items drop off when it gets busy, while the other three actually go up.
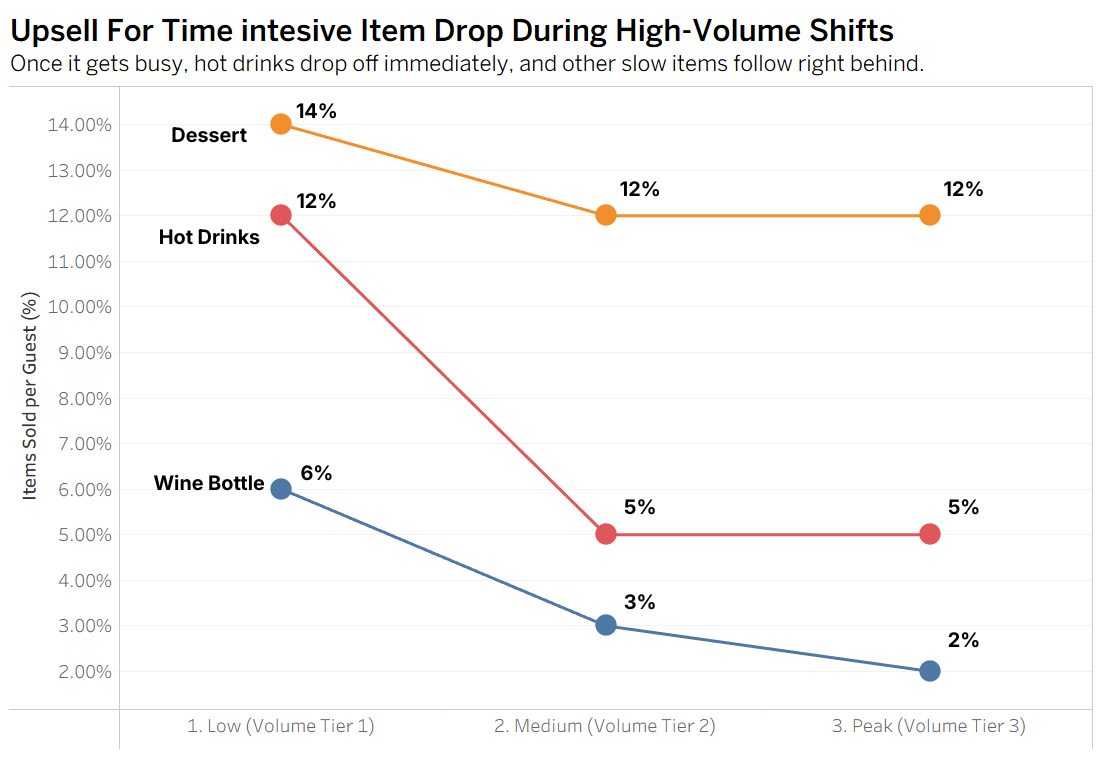
Wine, desserts, and hot drinks see a noticeable drop in sales during busier shifts.
These are highly time-intensive items;
wine requires a table-side tasting, while desserts and coffee require an entirely separate service step.
Once the floor gets busy and servers lose that extra time, these categories suffer.
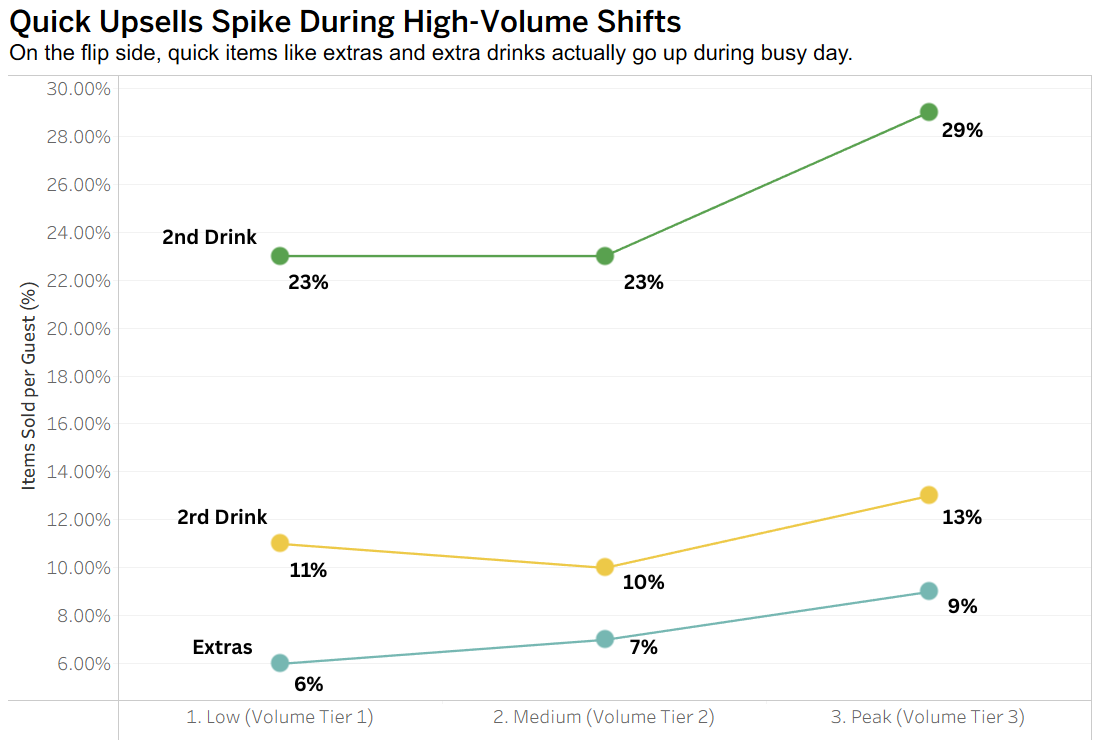
Conversely, low-friction items like extra sides and additional drink rounds actually increase during busy shifts.
Add-ons are pitched instantly during the main order, and as kitchen bottlenecks and service delays accumulate during a rush, guests end up waiting longer between courses.
This extended wait time creates natural, built-in opportunities to sell a second or third drink.
3. Individual Server Performance — Slow Shifts
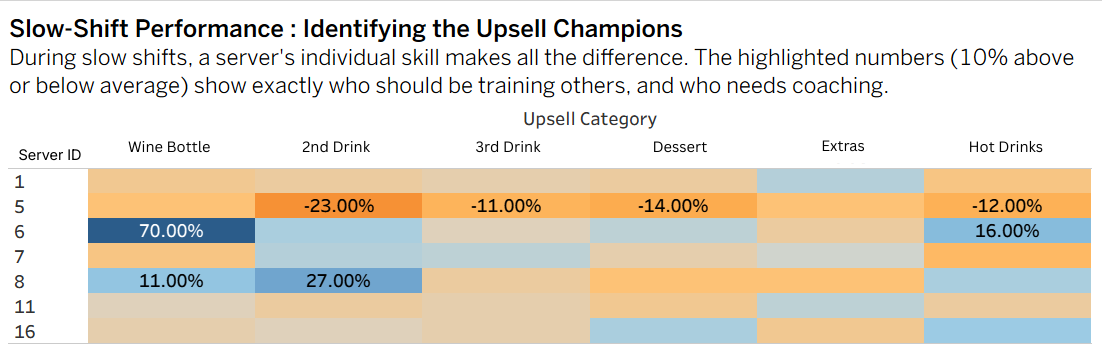
Wine : Server 6 single-handedly props up the slow-shift wine program (+70% over baseline). This reveals a massive skill gap across the rest of the staff, who consistently fall below average when pitching high-ticket items.
Extras & Dessert: Performance here dont peak. During slow shifts, servers have the time to pitch big-ticket items, so they don't bother relying on quick, low-friction add-ons.
Hot Drinks: Server 6 dominates this category as well, solidifying them as our absolute strongest performer on slow days.
Extra Drinks: Third drinks stay flat, likely because the window to sell them is so small. But for second drinks, we have a massive standout from srver 8 pulling +27% over the baseline.
The Underperformer: Server 5 struggles across the board. They consistently miss sales opportunities, falling 6% to 23% below average in every single category.
4.Performance Summary - Final Scoreboard
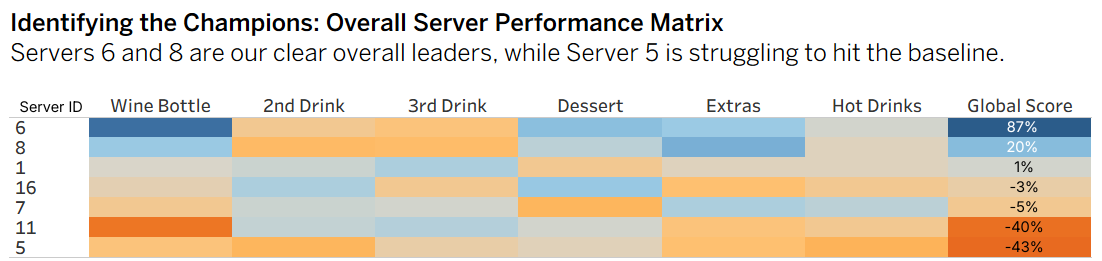
As established above, individual skill is the primary driver of performance during slow shifts — but during medium shifts, the picture changes dramatically.
Server 6's wine advantage shrinks from +70% to -2%, and the gap between top and bottom performers compresses across every category. By peak nights, individual performance becomes nearly indistinguishable from the baseline — the 93-point skill gap observed on slow nights collapses to just 12 points, regardless of which server is on the floor.
The following scorecard summarizes each server's variance from the restaurant baseline across all upsell categories during slow, medium and peak shifts.
PHASE 5: Act & Recommandation
Part 1: The Peak-Hour Reality Check (Top Priority)
Fix Operations Before Pushing Sales: During medium and high-volume shifts, the performance gap completely collapses, with all servers reverting to within 6% of the baseline. This proves that individual sales skills disappear under the pressure of a rush. Any new upsell training will fail during peak hours unless management first resolves the operational bottlenecks causing the stress. Fixing the speed of service and floor support must be the primary objective before enforcing new sales quotas.
Part 2: Implement Peer-Led Training (Slow & Medium Shifts) The baseline data clearly identifies our "Upsell Champions" during manageable shifts. Management should leverage these specific servers to train the rest of the staff:
The Wine & Coffee Champion (Server 6): Server 6 outperforms the house average by a massive 70% in wine and 16% in hot drinks. They should be scheduled to lead a workshop on high-ticket pitching and after-dinner timing.
The Refill Champion (Server 8): Server 8 beats the baseline by 27% on second drinks. They should share their exact floor strategy for timing table check-ins during the main course.
Part 3: Areas Requiring Management Intervention
Standardize Dessert & Extras Training: No server significantly beats the baseline for low-friction add-ons (the entire team hovers within 5% of the average). Since there is no internal champion to learn from, management must design and implement a new, standardized pitching strategy for these items.
Targeted Coaching for Server 5: Server 5 consistently falls 6% to 23% below the baseline across all categories. They require dedicated 1-on-1 shadowing to identify where they are missing core sales opportunities.
A 5% lift in second drink and 3% in wine bottle attachment rates — categories where we already have proven in-house expertise — represents an estimated $3,911 in incremental summer revenue. The following two-phase plan is designed to capture that opportunity :
Phase 1 — Floor Standardization (0-30 days): Bring all servers currently underperforming the baseline by more than 3% up to within 3% of the restaurant average through peer shadowing and standardized training. Success metric: no server falls more than 3% below baseline in any category.
Phase 2 — Elevate the Ceiling (30-60 days): Leverage Server 6's proven techniques in wine and hot drinks, and Server 8's second drink strategy, to lift the restaurant-wide baseline in those three categories. Success metric: wine bottle attachment rate increases by 3% and second drink attachment rate increases by 5% compared to last summer's baseline for the equivalent shift tier. These targets are deliberately conservative — a 3% floor-wide lift on wine represents only a fraction of Server 6's +70% advantage, and a 5% lift on second drinks covers just 18% of Server 8's +27% edge.
Calculation in the Appendix